LoadTester
LoadTester is a modern cloud-based tool for running distributed HTTP and API load tests from your browser or CI/CD pipeline without managing.
About LoadTester
LoadTester is a modern, cloud-native HTTP and API load testing tool developed by Cloud Native d.o.o. that eliminates the traditional pain points of performance testing. It empowers engineering teams to run sophisticated load tests without the overhead of provisioning, configuring, and managing testing infrastructure. With LoadTester, developers can create a test scenario, choose between virtual users or requests per second as their load model, and monitor live latency metrics and error rates in real time. The platform is built for scale, supporting up to 10,000 requests per second and 10,000 concurrent virtual users per test, with a cold start time of under three seconds from test launch to first request. It is designed for teams that need repeatable performance checks integrated into their development workflow. Key capabilities include automated threshold-based auto-stop, scheduled baseline tests, run-to-run comparisons to catch performance regressions, and comprehensive export options. LoadTester also offers API access, webhooks, Slack and email alerts, and seamless CI/CD pipeline integration, making it an ideal solution for organizations that want simple, reliable, and repeatable performance testing without the infrastructure complexity.
Features of LoadTester
Instant Distributed Execution
LoadTester launches distributed load tests in seconds without any infrastructure setup or worker orchestration. The platform automatically scales worker nodes to handle the specified load, eliminating scheduling headaches and queue times. With a cold start of under three seconds, teams can go from test creation to live traffic generation almost instantly, focusing entirely on analyzing results rather than managing execution flow.
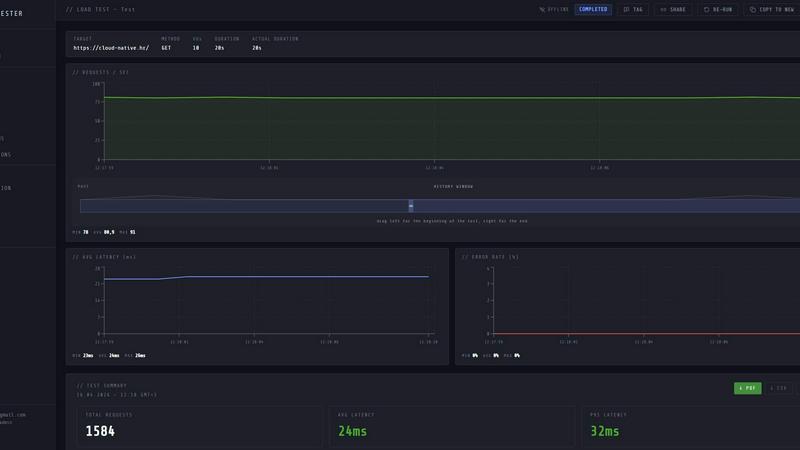
Live Real-Time Analytics
While a test is running, LoadTester provides a live streaming dashboard that displays critical metrics including requests per second, latency percentiles (p50, p95, p99), active virtual users, and error counts. This real-time telemetry allows engineers to observe performance bottlenecks and system behavior as they happen, rather than waiting for a post-run report. The latency distribution chart updates continuously over the last 60 seconds, providing immediate feedback on application responsiveness.
Smart Auto-Stop Thresholds
Users can define performance guardrails that automatically stop a test when predefined conditions are met. Thresholds can be set for p95 latency limits, maximum error rates, or regression comparisons against a baseline run. When a threshold is breached, LoadTester can automatically halt the test and trigger notifications via Slack or email. This feature prevents runaway tests from overwhelming systems and provides immediate alerts when performance degrades beyond acceptable levels.
CI/CD and Workflow Integrations
LoadTester is built for automation and team collaboration. It supports running tests directly from CI/CD pipelines, enabling performance checks on every deploy. The platform includes webhook support for triggering post-completion actions, such as sending result links to release bots. Scheduled tests can run automatically at defined intervals (e.g., nightly release gates), and results can be exported in PDF, CSV, or JSON formats for sharing with stakeholders.
Use Cases of LoadTester
Pre-Deployment Performance Validation
Engineering teams can integrate LoadTester into their CI/CD pipeline to automatically run load tests against staging or canary environments before every production deployment. By setting p95 latency and error rate thresholds, teams can catch performance regressions introduced by new code changes. If a test fails due to degraded performance, the pipeline can be blocked, preventing problematic releases from reaching users.
Spike and Stress Testing for E-Commerce
E-commerce platforms can use LoadTester to simulate traffic spikes during peak shopping events, such as Black Friday or product launches. By configuring a test with high requests-per-second rates against critical endpoints like checkout or search, teams can verify that their infrastructure can handle sudden surges. Live analytics allow monitoring of latency degradation in real time, and auto-stop thresholds prevent tests from causing actual production incidents.
Baseline Monitoring and Regression Detection
Teams can schedule daily or weekly baseline tests against production endpoints to establish normal performance patterns. LoadTester automatically compares each new run against the stored baseline and alerts via Slack or email if key metrics (e.g., p95 latency) degrade by a defined percentage (e.g., 15%). This proactive monitoring helps detect performance issues caused by infrastructure changes, increased traffic, or software updates before users notice.
Capacity Planning and Infrastructure Sizing
LoadTester enables teams to conduct controlled experiments to determine the maximum capacity of their services. By gradually increasing the number of virtual users or requests per second while monitoring latency and error rates, engineers can identify the breaking point of their application. The resulting data, exportable as CSV or JSON, provides evidence-based insights for scaling decisions, such as adding more servers or optimizing database queries.
Frequently Asked Questions
How does LoadTester handle infrastructure and scaling?
LoadTester is a fully managed platform that handles all infrastructure provisioning and worker scaling automatically. When you launch a test, the system dispatches the required number of distributed workers (up to 8 in the free plan) within seconds. You do not need to set up servers, manage queues, or orchestrate worker nodes. The platform scales workers based on your test configuration, allowing you to focus entirely on the test results.
What types of load models does LoadTester support?
LoadTester supports two primary load models: Virtual Users (VUs) and Requests Per Second (RPS). The VU model simulates a fixed number of concurrent users who continuously send requests, which is ideal for testing user session behavior. The RPS model maintains a constant rate of requests per second, which is better for measuring throughput capacity. You can select the appropriate mode when creating a new test scenario.
Can I run LoadTester tests from my CI/CD pipeline?
Yes, LoadTester is designed for CI/CD integration. You can trigger tests programmatically using its API, and the platform supports webhooks for receiving test completion events. This allows you to embed performance checks directly into your deployment pipeline, automatically blocking releases that fail predefined performance thresholds. Scheduled tests can also run independently at specified times, such as nightly or hourly.
What happens when a test exceeds a defined threshold?
When a test breaches a predefined threshold (e.g., p95 latency exceeds 400ms or error rate exceeds 2%), LoadTester can automatically stop the test to prevent unnecessary load on your systems. Additionally, the platform can send notifications via Slack or email to alert the responsible team. You can also configure webhooks to trigger custom workflows, such as posting the result link to a release bot or creating a ticket in your incident management system.
Similar to LoadTester
Blur & Unblur AI
Free online face blur and unblur tool with local browser processing.
WordPalette Generator
WordPalette Generator turns any word or image into a complete visual brand identity, including colors, fonts, and animations, all processed privately.
JustLaunched
JustLaunched helps indie makers schedule product launches, reach buyers, and blast across curated directories to get discovered.
Polymarket Trading Bot For Crypto
Automate high-frequency Bitcoin Up or Down trades on Polymarket using a transparent, locally-run bot that replicates a proven strategy.
Push My App
Push My App lets developers manage, optimize, and deploy ASO metadata and listings to both app stores from a single dashboard.